
Bitcoin’s latest rally has carried the asset back into an area where sellers have previously regained control. The coming sessions should reveal whether this recovery has enough strength to continue or if another rejection is waiting around the corner.
Bitcoin Price Analysis: The Daily Chart
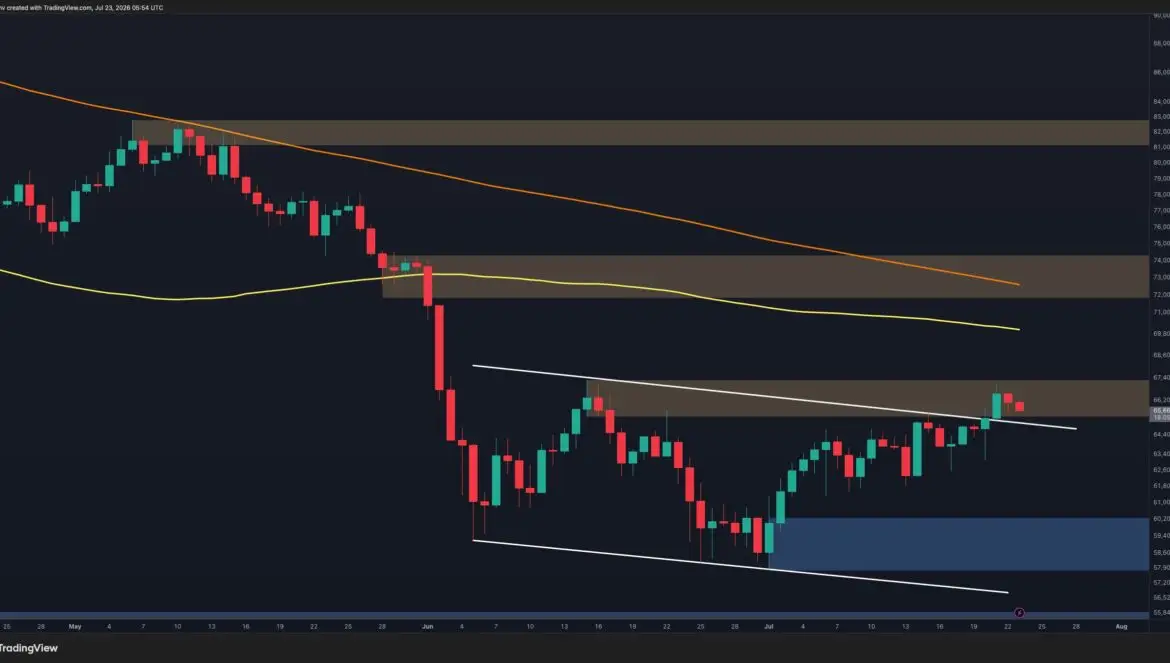
On the daily timeframe, BTC has extended its recovery into the $65.5K-$66.7K supply zone after successfully reclaiming the descending trendline that had capped the price action for weeks. While this breakout represents a notable improvement in market structure, the broader trend remains constrained beneath the declining 100-day moving average, with the 200-day moving average positioned even higher.
The current resistance zone also coincides with a previous distribution area, increasing the likelihood of seller activity around current levels. A decisive daily close above $66.7K would strengthen the bullish case and expose the next resistance around $72K-$74K.
On the downside, the former breakout area near $63K-$64K now serves as the first demand zone. As long as BTC holds above this region, buyers remain in short-term control. Losing this support would shift attention back toward the broader demand zone around $58K-$59.5K, where the latest impulsive rally originated.
BTC/USDT 4-Hour Chart
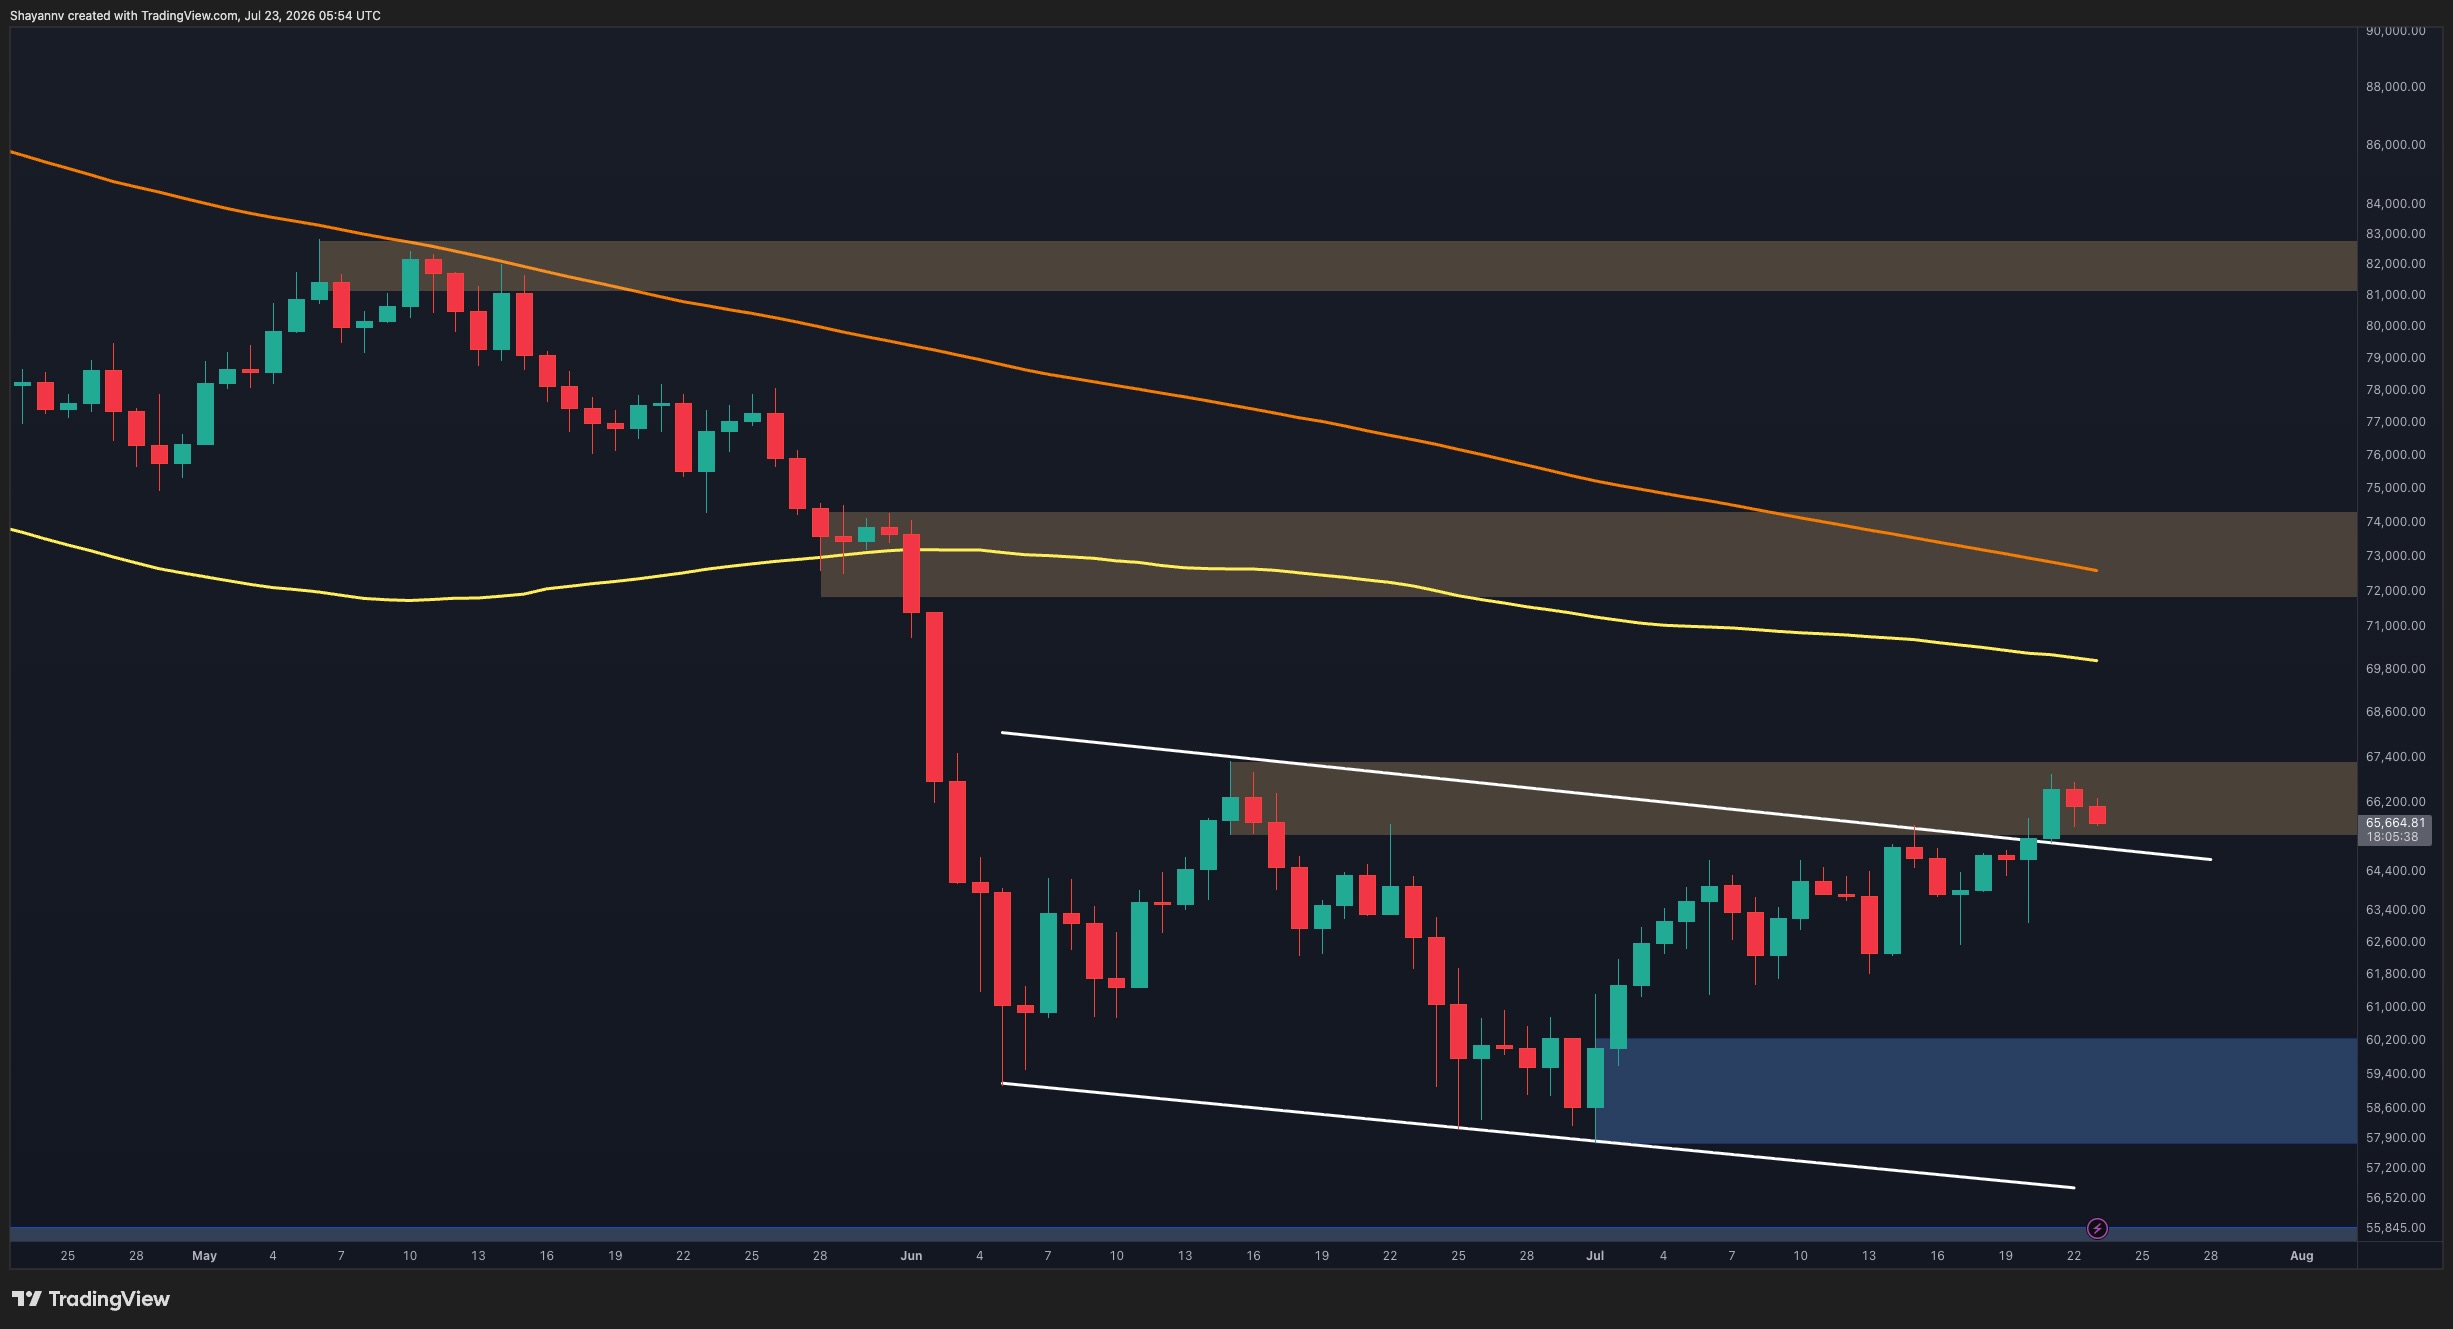
The 4-hour chart highlights a clear shift in momentum after Bitcoin broke above the descending trendline and rallied directly into the overhead supply zone around $65.5K-$66.7K. The market is now consolidating beneath resistance after rejecting the upper boundary of the range.
This pause appears consistent with profit-taking rather than a confirmed trend reversal, especially since the previous resistance trendline has already been reclaimed. If buyers manage to absorb the current supply, a breakout above $66.7K could trigger another impulsive leg higher.
However, failure to sustain current levels would likely result in a pullback toward the $63K-$64K demand zone, which aligns with the recently broken trendline and could serve as the next area for buyers to defend before another attempt higher.

Sentiment Analysis
The one-year Binance liquidation heatmap shows a notable concentration of short-side liquidity around the $88K region, standing out as one of the largest untouched liquidity pools above the current market price.
From a market structure perspective, this aligns with the broader idea that Bitcoin may eventually be drawn toward that liquidity. However, until price sweeps the $90K cluster and successfully establishes acceptance above it, it is difficult to argue that the higher-timeframe trend has fully transitioned into a bullish market.
As a result, the current recovery should still be viewed with caution. Although the technical structure has improved over the short term, every bullish leg can still be interpreted as corrective within the broader bearish context until the major overhead liquidity is cleared and price stabilizes above that region.

The post Bitcoin Price Analysis: BTC Rally Loses Steam as Historical Resistance Comes Into Play appeared first on CryptoPotato.